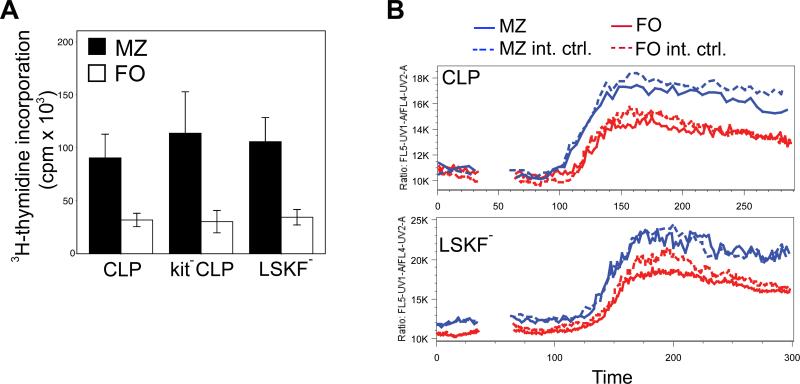
Fig. 5. Functional analysis of FO and MZ B cells according to progenitor origin.
(A) LPS-induced proliferation, measured by 3H-thymidine incorporation, of MZ and FO B cells generated from 1,500 CLPs, kit-CLPs and LSKF- cells three weeks after transfer into Rag1-/- mice (n = 3 independent experiments, all differences between MZ and FO B cells P < 0.05). (B) Ca2+-flux, as measured by ratiometric analysis of Indo-1 fluorescence gated on FO and MZ B cells generated 3 weeks after adoptive transfer of 1,500 CD45.1+ CLPs (upper panel) and LSKF- cells (lower panel) into Rag1-/- mice. Wt CD45.2+ C57BL/6 spleen cells were added to the samples as an internal control, and analyzed according to the same MZ/FO gates.

