
Figure 3.
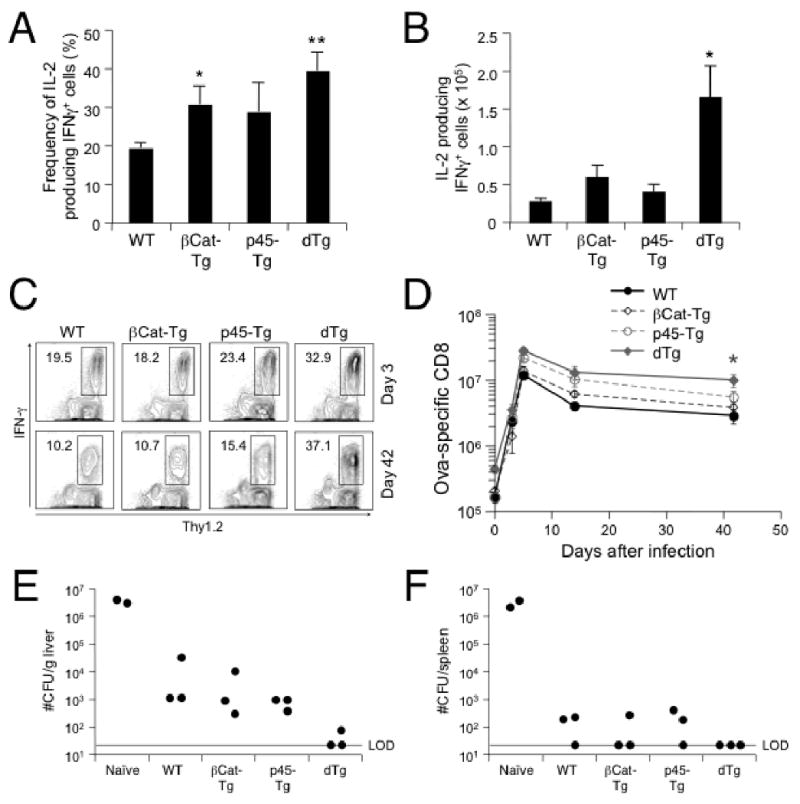
Memory CD8 T cells generated in the presence of constitutively active Wnt signaling manifested enhanced functionality. (A) Frequency and (B) numbers of IL-2 producing Ova-specific memory CD8 T cells. The numbers were calculated from the frequency of IL-2+IFN-γ+ cells (A) and the absolute number of Ova-specific CD8 T cells on day 42 post-infection as in Fig. 2G. (C) and (D) Secondary antigen-specific CD8 T cell responses. Mice of indicated genotypes were first immunized with act-LM-Ova as in Fig. 2, and detection of Ova-specific CD8 T cells on day 42 post-immunization was confirmed in periphery blood leukocytes by intracellular staining for IFN-γ (data not shown). The immunized mice were then infected with virulent LM-Ova, and CD8 responses to Ova were determined. Ova257-264-specific CD8 T cells at day 3 and day 42 after secondary infection were detected as Thy1.2+IFN-γ+ CD8 cells, with the percentages shown in (C). Total numbers of antigen-specific CD8 T cells per spleen in each group are shown in (D) as means ± s.e.m. (E) and (F) Clearance of secondary bacterial infection by primary CD8 memory T cells. Naïve or immunized mice were infected with virulent LM-Ova and 3 days later, livers and spleens were harvested and CFUs were determined. Data are reported as CFU numbers per gram of liver (E) or per spleen (F). LOD, limit of detection. Each symbol represents one mouse. All data are from one of 2 independent experiments with similar results. *, p<0.05; **, p<0.01 by t-test for each group of Tg mice versus WT controls.