
Table 5.
Genes Differentially Expressed between Biopsy Locations
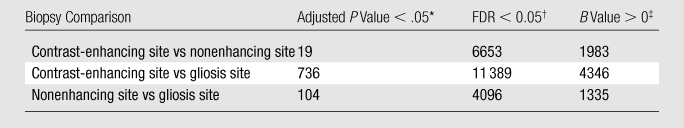
Note.—Data are numbers of genes. FDR is less stringent than adjusted P value in controlling the false-positive rates. B statistics are more powerful in the detection of weak gene differential gene expression but are not comparable with the other two methods in terms of the false-positive rate.
An adjusted P value of .05 indicates that the declared differential gene expression set has a 5% chance to have at least one false-positive finding for each gene comparison of interest.
FDR is the percentage of falsely declared differential gene expression among the set of declared differentially expressed genes. An FDR cutoff of 0.05 indicates that 5% of the declared differentially expressed genes are expected to be false-positive findings.
B statistic (log10 posterior odds ratios) greater than 0 indicates equal probability or better that a gene is differentially expressed as opposed to nondifferentially expressed between sample groups.