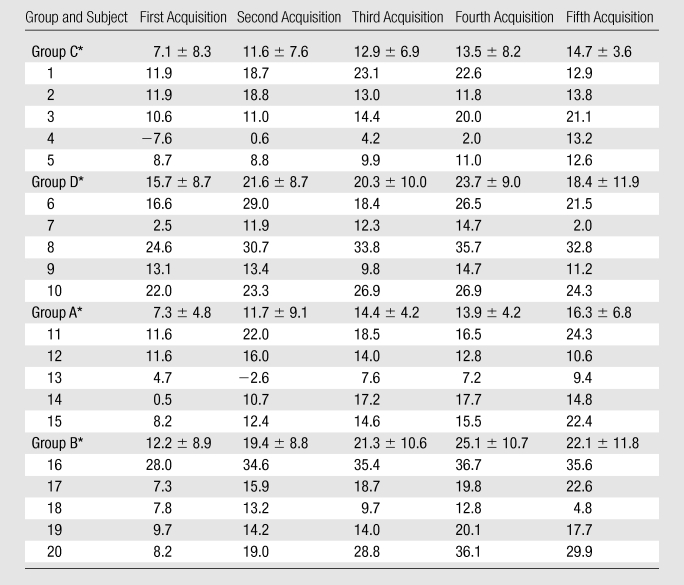
Table 2.
Percentage Changes in Individual RCA Vessel Diameters after ISDN Administration

Note.—Data are percentages. Group A = SSFP sequence with 2.5 mg of ISDN, group B = SSFP sequence with 5 mg of ISDN, group C = GRE sequence with 2.5 mg of ISDN, group D = GRE sequence with 5 mg of ISDN.
Data are means ± standard deviations.
