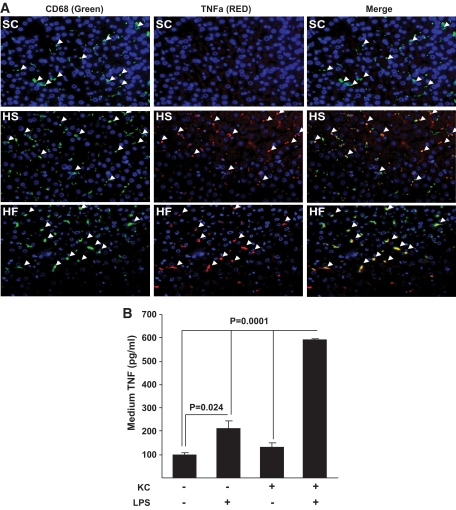
FIG. 7.
TNFα expression in KCs in liver in response to standard chow, high-fat, and high-sucrose diets and TNFα secretion from isolated M1-polarized KCs. Male Wistar rats were exposed to a high-fat or high-sucrose diet for 2 weeks. Subsequently, the livers were isolated, sections were prepared, and immunofluorescent staining for KCs and TNFα was performed (A), as described in research design and methods. The left panel shows CD68/ED1-positive cells (green), the center panels show TNFα-positive cells (red), and the right panels show the merged images. In all panels, Hoechst staining was used to visualize cell nuclei (blue). n = a minimum of three. For in vitro experiments (B), hepatocytes and KCs were isolated from rat livers, plated, and cultured as shown. After the indicated exposures, media were taken and TNFα was quantified by enzyme-linked immunosorbent assay (ELISA). Data are presented as means ± SE. Statistical significance is indicated. n = a minimum of three in each group. (A high-quality digital representation of this figure is available in the online issue.)

