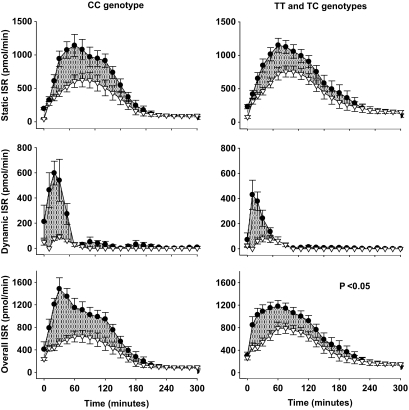
FIG. 2.
Insulin secretory indexes during the 5-h OGTT (●) and isoglycemic intravenous glucose infusion (△) in control subjects and carriers of the at-risk TCF7L2 variant. Shaded areas indicate the incretin effects. P values indicate the significance of the differences in incretin effects between groups. Values are means ± SE.

