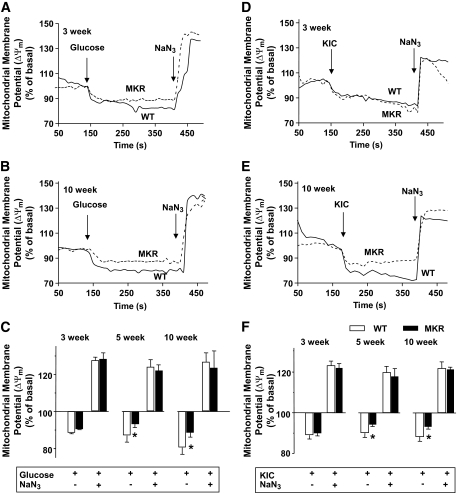
FIG. 2.
Decreased mitochondrial membrane potential (ΔΨm) in 5- and 10-week-old MKR β-cells. Mitochondrial membrane potential was measured using Rh123 in dispersed islet cells from 3-week-old (A and D), 5-week-old (Fig. S2), and 10-week-old (B and E) MKR (gray dashed lines) and WT (solid black lines) mice. Mitochondrial membrane potential was estimated by the difference in Rh123 fluorescent signals between hyperpolarized (glucose, 11 mmol/l, A and B; ketoisocaproate [KIC], 10 mmol/l, D and E) and basal and fully depolarized (sodium azide, 5 mmol/l) states. A, B, D, and E: Representative kinetic traces of the fluorescent signal from a single β-cell. C and F: Summary of ΔΨm changes compared with basal levels in WT (□) and MKR (■) islet cells. Results are the percent change from basal fluorescence (1 mmol/l glucose before additions) (n = 3–5 independent experiments, and each experiment used 30–50 cells from three mice per genotype). Data are means ± SE. *P < 0.05 compared with age-matched WT.

