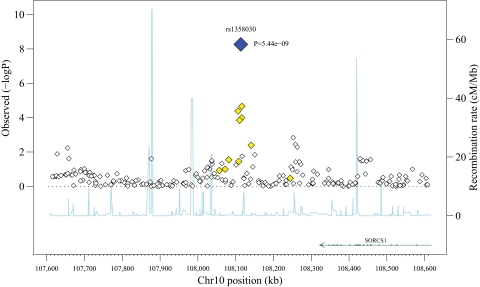
FIG. 1.
Association results for mean A1C levels in the conventional treatment group at a 500-kb region surrounding rs1358030 (SORCS1). On the left y-axis is the −log10 (P value) for each SNP genotyped. On the right y-axis and the line is the recombination rate estimated from our data. The annotated genes in the region are indicated along the bottom of the figure. SNPs are colored based on their linkage disequilibrium with the most significant SNP, i.e., rs1358030, where black indicates the index SNP, light grey indicates 0.2 < r2 < 0.5, and white indicates r2 ≤ 0.2 (see the online version of the figure for colors where blue indicates the index SNP and yellow indicates 0.2 < r2 < 0.5).

