FIG. 2.
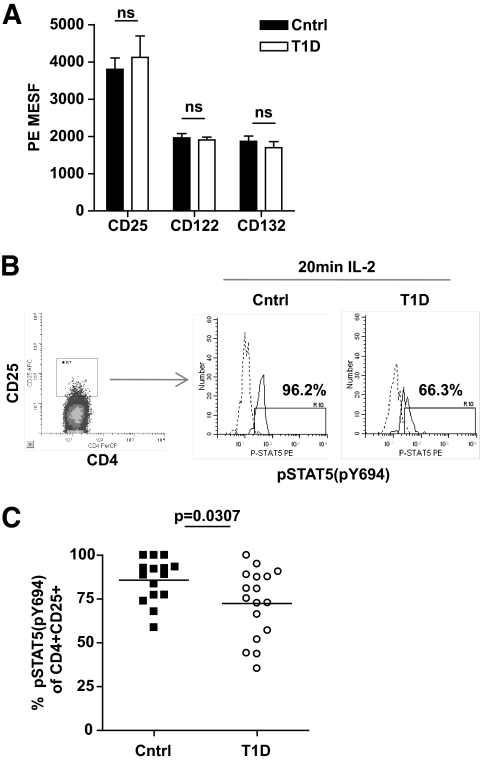
nTregs of type 1 diabetic subjects display impaired IL-2R signaling. A: Level of expression of CD25, CD122, and CD132 in the CD4+CD25+ population of control (n = 17) and type 1 diabetic (n = 11) subjects from Fig. 1C was determined using Quantum R-PE MESF beads. B: Thawed PBMCs from a representative control and type 1 diabetic subject were stimulated with 100 IU/ml IL-2 for 20 min prior to fixation and staining with CD4, CD25, and pSTAT5(Y694). Dashed lines are treatment with media alone and solid lines are treatment with IL-2. C: Multiple control (n = 15) and type 1 diabetic (n = 17) subjects were stimulated as in B. Bars show means and symbols represent individual subjects. Analysis of pSTAT5 was performed by gating on live CD4+CD25+ T-cells. Statistical significance was determined using an independent Student t test.

