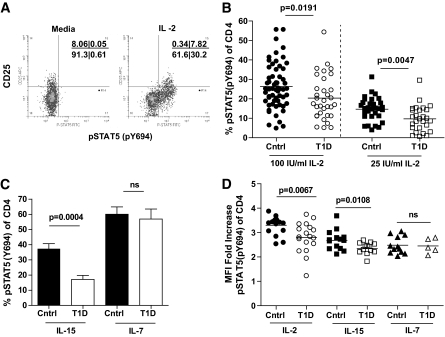
FIG. 4.
CD4+ T-cells of type 1 diabetic subjects display diminished responsiveness to IL-2. Thawed PBMCs from control subjects were stimulated with 100 IU/ml IL-2 for 10 min prior to fixation and staining for CD4, CD25, and pSTAT5(Y694). Analysis was performed by gating on total live CD4+ T-cells and comparing response to media alone versus cytokine stimulation. A: Staining for one representative sample is shown. B: The frequency of CD4+ T-cells that were pSTAT5(Y694)+ in response to IL-2 was determined for control (n = 59) and type 1 diabetic (n = 33) subjects. Bars represent means and symbols represent individual subjects. C: Control (n = 12) and type 1 diabetic (n = 13) subjects were assayed for pSTAT5(Y694) in response to stimulation for 10 min with 200 pg/ml IL-15 or 40 pg/ml IL-7. Bars represent means ± SEM. D: MFI fold increase of pSTAT5(Y694) in STAT5+ CD4+ T-cells of thawed PBMCs from control (n = 12) and type 1 diabetic (n = 14) subjects was determined by comparing pSTAT5(Y694) MFI after stimulation with IL-2, IL-7, and IL-15, or media alone. Bars show means and symbols represent individual subjects. All P values were determined using an independent Student t test.

