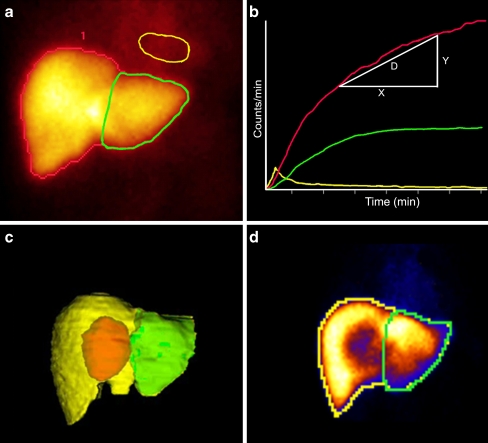
Figure 1.
An example is shown of summed HBS images from 150–300 s after i.v. injection of 99mTc-mebrofenin (a). A ROI is drawn around the entire liver (red line) and around the mediastinum (blood pool; yellow line). A third ROI is drawn around the future remnant liver (green line). A blood pool corrected liver-uptake time–activity curve is shown in b. The hepatic 99mTc-mebrofenin uptake is calculated as an increase of 99mTc-mebrofenin uptake (y-axis) per minute over a time period of 200 s (x-axis). c The use of the anterior projection of the liver on the CT volumetry image as a guideline for delineating the FRL on the HBS image (d).

