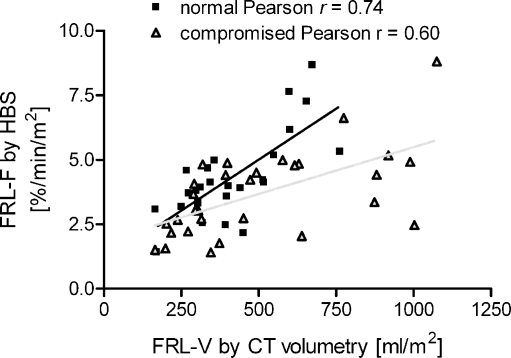
Figure 4.
Scatter plot showing the correlation between FRL-F and FRL-V. In patients with normal livers (black line), FRL-V correlated well with FRL-F (Pearson r = 0.71, P = 0.0001). Patients with compromised livers (gray line) showed a moderate correlation between FRL volume and FRL function (Pearson r = 0.61, P < 0.0003).

