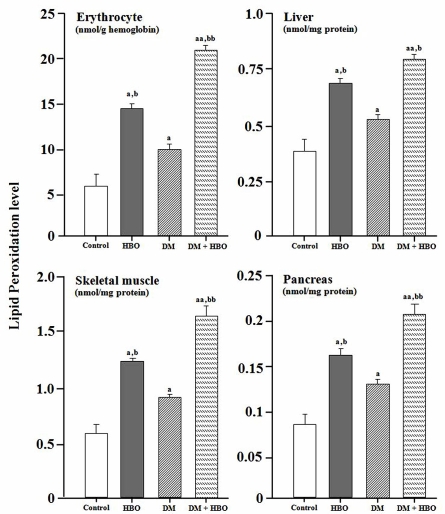
Figure 2.
Comparison of lipid peroxidation levels (TBARS) in the erythrocyte, liver, skeletal muscle, and pancreas among non-diabetic rats in the non-HBO (control), non-diabetic rats in the HBO (HBO), diabetic rats in the non-HBO (DM), and diabetic rats in the HBO (DM + HBO) groups. TBARS values are indicated as nmol/g hemoglobin in erythrocytes and as nmol/mg protein in the various organs. Values are expressed as mean ± SEM (n = 6). a Represents significance at p < 0.05 and aa represents significance at p < 0.005 compared with the control groups. b Represents significance at p < 0.05 and bb represents significance at p < 0.005 compared with the DM groups.

