Figure 3.

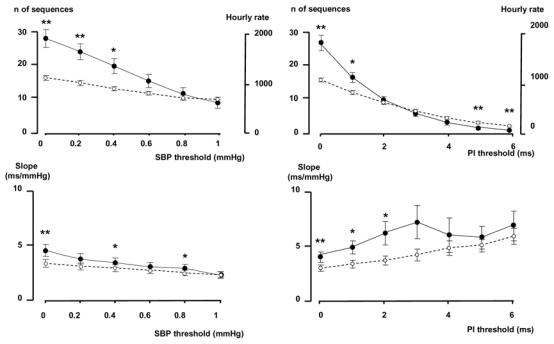
Effects of introducing a threshold in SBP (left pannel) or in PI (right panel) on the number of sequences and the slope. Full dots: original data, open dots: surrogate data. *p<0.05, **p<0.01, ***p<0.001, original data vs surrogate data.

Effects of introducing a threshold in SBP (left pannel) or in PI (right panel) on the number of sequences and the slope. Full dots: original data, open dots: surrogate data. *p<0.05, **p<0.01, ***p<0.001, original data vs surrogate data.