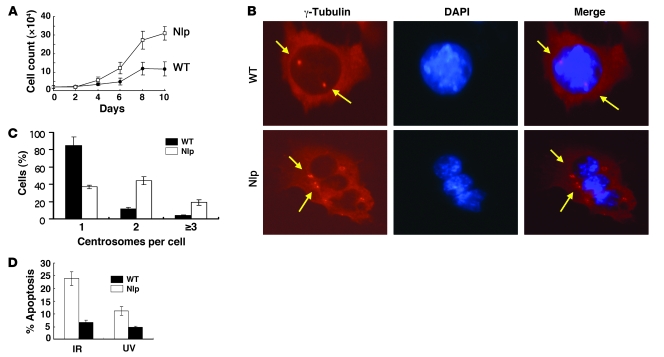
Figure 7. Analysis of MEFs derived from transgenic mice.
(A) MEFs isolated from both normal and Nlp transgenic mice were plated in 30-mm tissue culture dishes, and cells were collected for counting each day. Three separate experiments were conducted. Data are presented as mean ± SEM; n = 6–9. (B) MEFs isolated from normal or Nlp transgenic mice were stained for centrosomes with γ-tubulin antibody and counterstained with DAPI. Arrows indicate the positions of centrosomes in MEFs derived from either normal (WT) or Nlp transgenic animals. Original magnification, ×400. (C) Quantitative results of centrosome analysis in MEFs were obtained from 3 separate experiments, and in each experiment, more than 400 cells were examined. Data represent percentages of cells with different centrosome copies and are presented as mean ± SEM. (D) Expression of Nlp-attenuated apoptosis induced by IR and UV radiation. MEFs from normal and Nlp transgenic mice were treated with IR at a dose of 15 Gy and UV radiation at a dose of 30 J/m2. Cells were collected 16 hours later for examination of apoptosis. Data are presented as mean ± SEM; n = 9–12.

