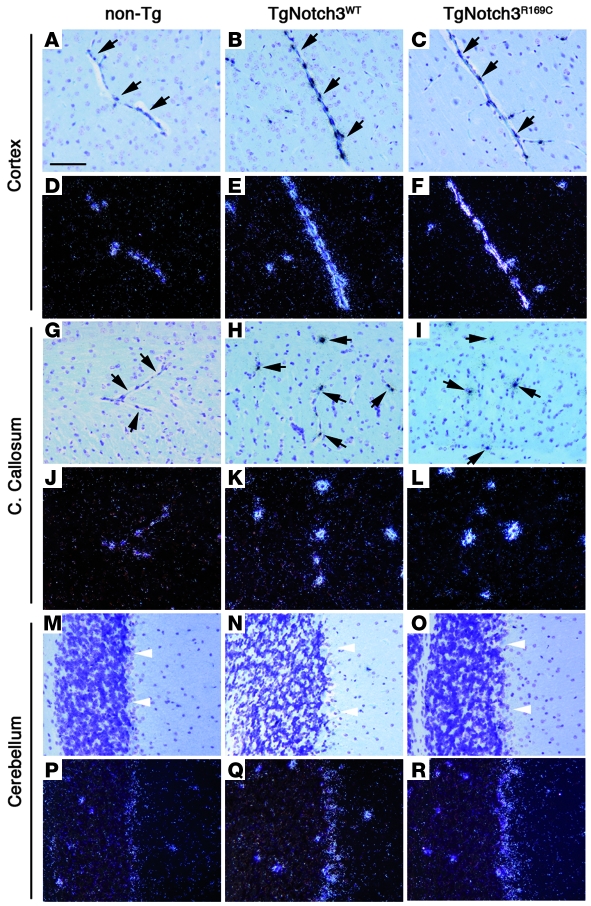
Figure 2. Transgenic mice overexpress Notch3 in an endogenous-like expression pattern.
In situ hybridization with a Notch3 antisense riboprobe on sections of the cortex (A–F), corpus callosum (G–L), and cerebellum (M–R) from 1-month-old nontransgenic, TgNotch3WT (line 129), and TgNotchR169C (line 88) mice. Bright- and dark-field images are shown on the upper and lower panel of each structure, respectively. In the cortex and corpus callosum, Notch3 expression was essentially detected in the capillaries (black arrows), with a robust signal in transgenic mice and lesser signal in non-transgenic mice. Weaker expression was also detected in the Bergmann glial cells of the cerebellum (white arrowheads) in both nontransgenic and transgenic mice, with higher expression in the latter. Note that brains were formalin fixed by immersion without prior transcardiac perfusion of the mice. Scale bar: 60 μm.

