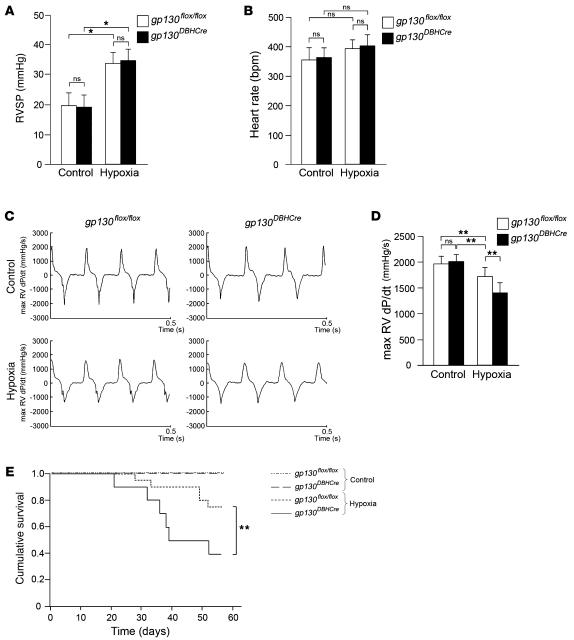
Figure 7. Cardiac function and Kaplan-Meier analysis of gp130flox/flox and gp130DBH-Cre mice under chronic hypoxia.
(A) Measurement of the RVSP under chronic hypoxia at 8 weeks. (B) Measurement of the heart rate under chronic hypoxia at 8 weeks. (C) Representative recordings of maximum (max) RVdP/dt under chronic hypoxia at 8 weeks. (D) Quantitative analysis of maximum RVdP/dt under control conditions and under chronic hypoxia at 8 weeks. (E) Kaplan-Meier analysis of the cumulative survival under control conditions and under chronic hypoxia. *P < 0.01; **P < 0.05.

