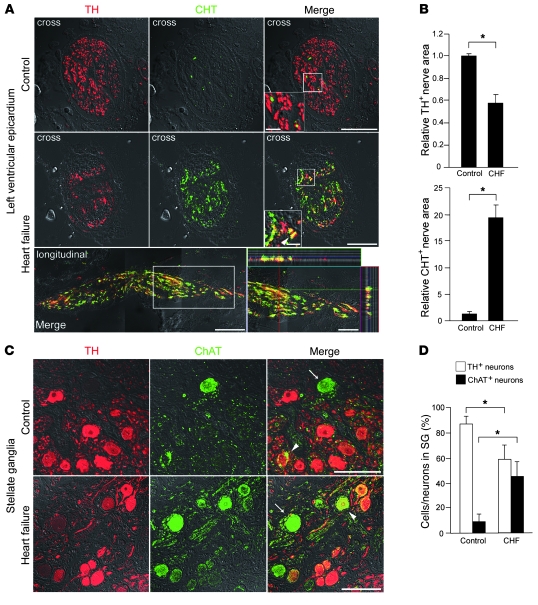
Figure 9. Neurotransmitter switching in the human cardiac sympathetic nervous system.
(A) Representative immunostaining for TH (red) and CHT (green) in LVs at the epicardial sites in control and heart failure patients. Cross and longitudinal sections are shown. The longitudinal image is composed of 3 serial images. The heart failure group has fewer TH+ nerves and markedly more CHT+ nerves than the control group. In the ventricle of heart failure patients, some CHT+ nerves coexpress TH (arrowhead). The longitudinal section also revealed sympathetic nerves coexpressing TH and CHT. Higher-magnification views of the boxed regions are shown in the insets (right panels). (B) Quantitative analysis of TH+ and CHT+ nerve areas in LV (n = 4). (C) Representative immunostaining for TH (red) and ChAT (green) in the stellate ganglia of control and heart failure patients. Arrows indicate ChAT+ cells, and arrowheads indicate TH+/ChAT+ neurons. The heart failure group has fewer TH+ cells and more ChAT+ cells than the control group. (D) Quantification of TH+ and ChAT+ cells per total number of neurons in the stellate ganglia (n = 5). Representative data are shown in each panel. *P < 0.01. Scale bars: 10 μm (A, insets); 50 μm (A and inset in D); 100 μm (C).

