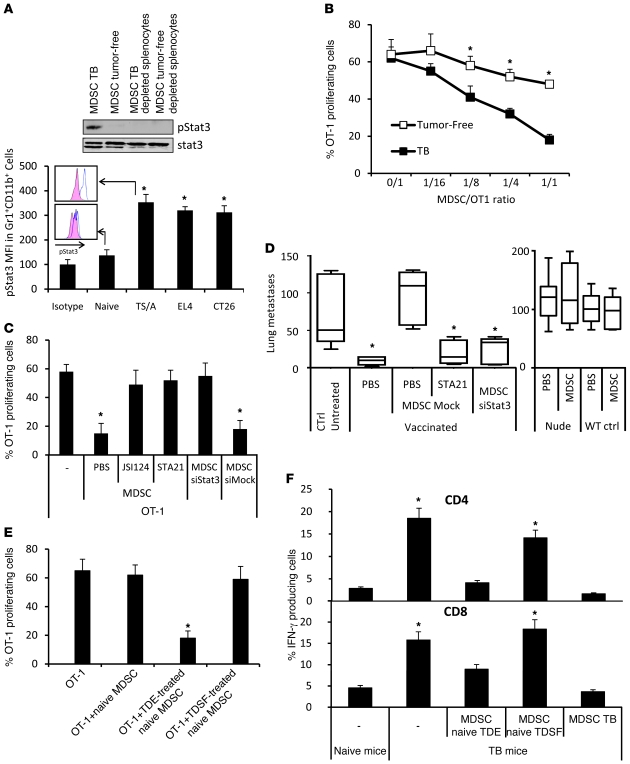
Figure 2. TDE-induced Stat3 activation determines MDSC suppressive functions.
(A) Expression of pStat3 in MDSCs from naive and tumor-bearing mice (TB) was determined by Western blotting (upper panel) and FACS (lower panel). (B) CFSE-labeled OT-1 cells loaded with SIINFEKL and cultured alone or with MDSCs isolated from TB or naive mice at different MDSC/OT-1 ratios. Percentage of OT-1 proliferating cells was determined by flow cytometry (n = 3). (C) Peptide-loaded, CFSE-labeled OT-1 cells were cultured alone or with MDSCs isolated from TB mice treated with PBS, JSI124, STA21, or Stat3 siRNA. CFSE dilution was determined by flow cytometry (n = 3). (D) Nude or WT mice were vaccinated or not with frozen/thawed CT26 cells 1 week before i.v. injection of CT26 cells admixed or not with MDSCs isolated from TB and previously treated with STA21 or Stat3 siRNA. 2 weeks later, lung metastasis numbers were evaluated (n = 5 mice per group). For box and whisker plots, bottoms and tops of boxes show the 25th and 75th percentiles, respectively, and middle bands show the median; whiskers show extrema. (E) Peptide-loaded, CFSE-labeled OT-1 cells were cultured alone or with bone marrow–derived MDSCs of naive mice previously treated alone or with tumor cell whole supernatant or TDE or TDSF fractions. CFSE dilution was determined by flow cytometry (n = 3 mice per group). (F) TB mice were injected or not with MDSCs. These MDSCs were either from TB or naive mice and stimulated with PBS, TDEs, or TDSFs. 2 days later, spleen cells were harvested and restimulated in vitro with CD3mAb+ dead tumor cells, then stained for intracellular CD4 and IFN-γ (upper panel) or CD8 IFN-γ (lower panel). *P < 0.05. Error bars represent mean + SD.

