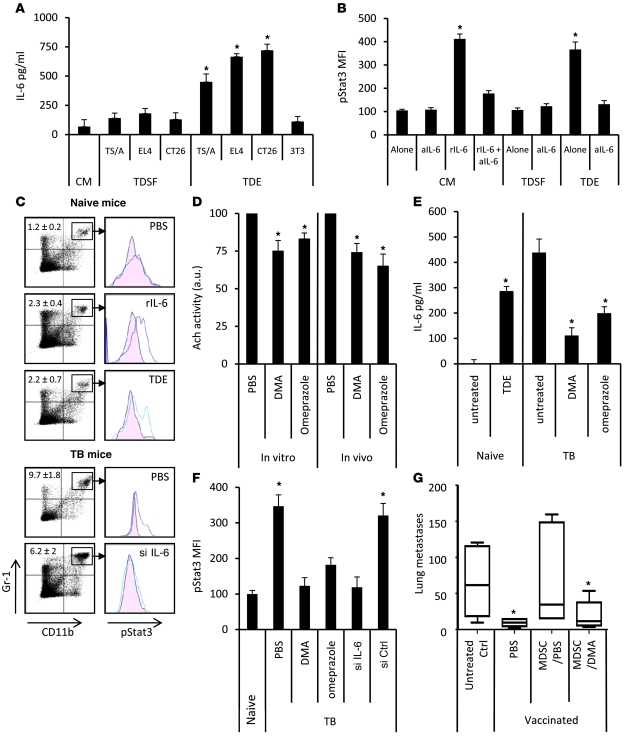
Figure 3. TDEs trigger pStat3 expression in MDSCs through autocrine production of IL-6.
MDSCs from naive mice were treated with PBS or with TDSFs or TDEs. (A) IL-6 concentration in the supernatant was determined by ELISA. (B) In some wells, rIL-6 or blocking anti–IL-6 mAb (aIL-6) were added. Data represent pStat3 MFI ± SD. (C) Naive mice were i.v. injected with PBS, EL4 TDEs, or rIL-6. EL4 TB mice were i.v. injected with PBS or IL-6 siRNA. 24 hours later, spleens were harvested. MDSC percentage (denoted) and pStat3 expression were determined by FACS on gated MDSCs. (D) EL4 cells were cultured in vitro for 24 hours and treated with PBS, DMA, or omeprazole. In vivo EL4 TB mice were injected daily with DMA for 1 week. Acetylcholine esterase activity was assayed in supernatant or sera. (E) IL-6 concentration in sera was determined by ELISA in naive mice, which received a single injection of PBS or EL4 TDEs (left), or in EL4 TB mice, which received 1 daily injection of PBS, DMA, or omeprazole for 1 week (right). (F) EL4 TB mice were injected with PBS alone or DMA, omeprazole, or IL-6 siRNA (si). Spleens were harvested 24 hours later, and pStat3 expression was determined by FACS. Data are shown as MFI ± SD. (G) Mice (n = 5) were vaccinated with frozen/thawed CT26 cells 1 week before i.v. injection of live CT26 admixed or not with MDSCs isolated from PBS- or DMA-treated CT26 TB mice. Twelve days later, lung metastasis number was evaluated. Each experiment was done in triplicate. For box and whisker plots, bottoms and tops of boxes show the 25th and 75th percentiles, respectively, and middle bands show the median; whiskers show extrema. *P < 0.05.

