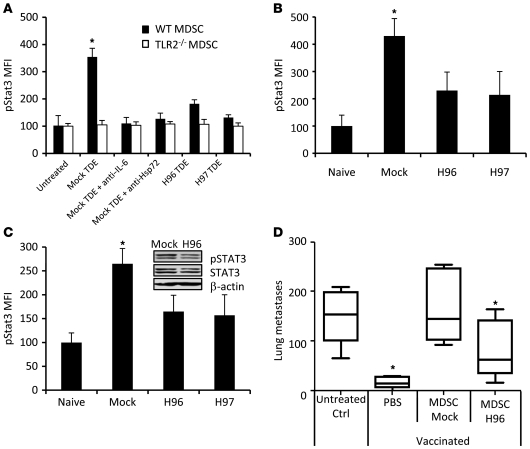
Figure 6. pStat3 expression in MDSCs is dependent on Hsp72 on TDEs.
(A) Purified myeloid cells from naive WT or TLR2-deficient mice were either untreated or treated as indicated. (B) Naive mice were i.v. injected with TDEs from shRNA mock CT26 cells or Hsp72 shRNA CT26 clones H96 or H97. 18 hours later, spleen cells were harvested and pStat3 expression was determined by FACS. (C) Naive BALB/c mice were s.c. injected with 1 × 10⁶ H96, H97, or mock CT26 cells. 2 weeks later, spleens were harvested and pStat3 expression determined by FACS. For A–C, pStat3 was determined by FACS analysis on MDSC gated cells. Data represent MFI ± SD. Experiments were performed in triplicate (n = 3 mice per group). Inset shows immunoblot of pStat3 expression in sorted MDSCs from mice bearing mock CT26 or Hsp72 shRNA CT26 clone H96. (D) Mice were vaccinated with frozen/thawed CT26 cells 1 week before i.v. injection of live CT26 cells admixed or not with MDSCs isolated from mice bearing shRNA mock-transfected or Hsp72 shRNA-transfected (clone H96) CT26 tumors. Twelve days later, lung metastasis numbers were evaluated. Experiments were performed in triplicate (n = 5 mice per group). For box and whisker plots, bottoms and tops of boxes show the 25th and 75th percentiles, respectively, and middle bands show the median; whiskers show extrema. *P < 0.05. Error bars represent mean + SD.

