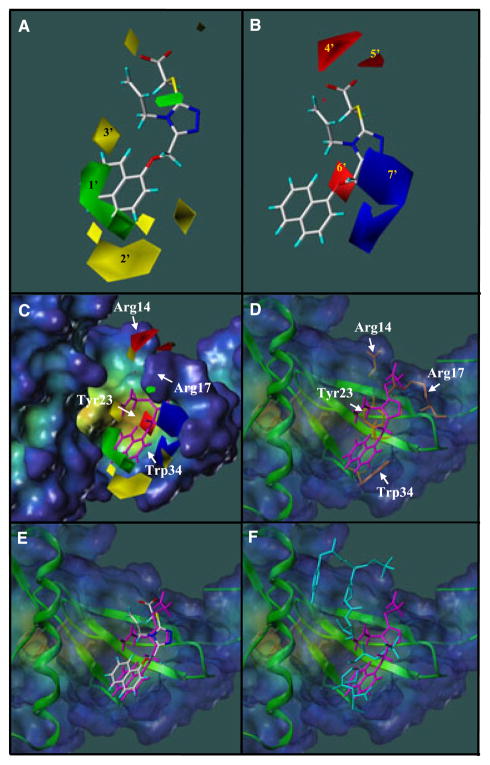
Figure 4.
(A) CoMFA steric contour map displayed together with compound 29. Green contour indicates favorable steric regions and yellow contours indicate disfavorable steric regions. (B) CoMFA electrostatic contour maps displayed together with compound 29. Red contours indicate region where more electronegative substituents are favorite, whereas blue contours indicate regions where such substituents are disfavored. (C, D) Comparison of the contour maps from the CoMFA analysis and the binding pocket of Pin1ww in the crystal structure. Compound 29 is in magenta. Residues Arg14, Arg17, Tyr23 and Trp34 are in orange and their respective position are reported on the surface. (E) Comparison of binding modes of compound 29 in the docking complex (magenta) and the CoMFA model. (F) Comparison of binding modes of docked compound 29 and the CTD phosphopeptide in the crystal structure (cyan).

