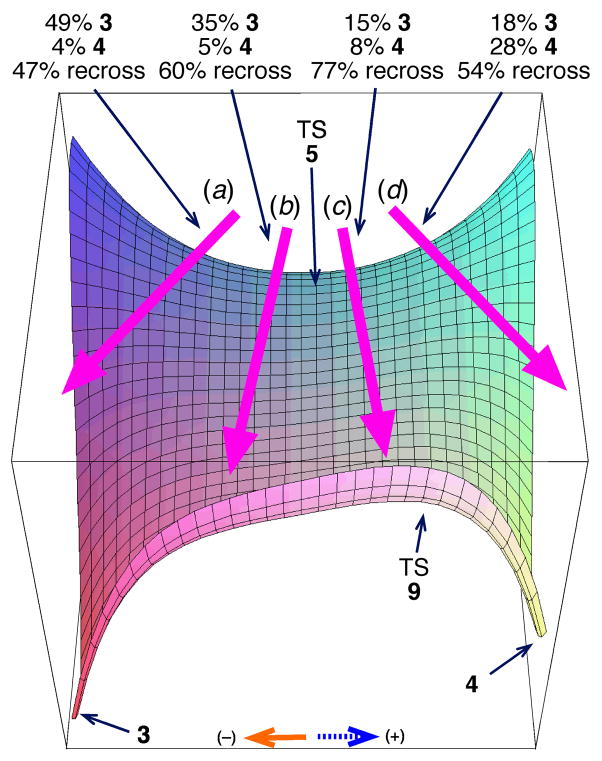
Figure 4.
Outcome of trajectories versus the angle (see text) at which they leave the transition state. On this qualitative potential energy surface, the horizontal axis corresponds to motion along the 98-cm−1 vibrational mode and the orthogonal axis is motion along the transition vector. The arrows labeled a, b, c, and d refer to trajectories within a range of angles: a: <−26°; b: between −26° and 0°; c: between 0° and 26°; d: >26°.

