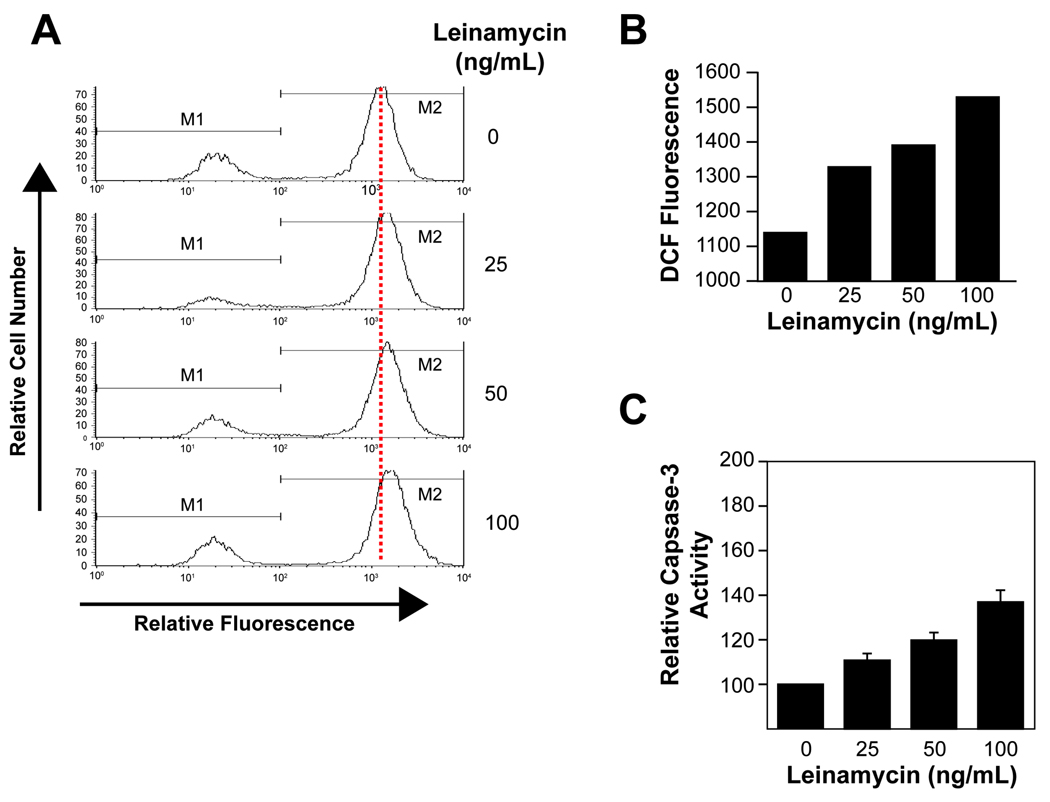
Figure 3.
A, flow cytometric analyses of the fluorescence of leinamycin-treated MiaPaCa cells at various concentrations for 2 h. MiaPaCa cells were treated with 0, 25, 50, or 100 ng/mL leinamycin for 2 hours. Drug-treated MiaPaCa cells were incubated with 0.4 mM DCFH-DA for 30 min, and then washed with PBS. DCF fluorescence was quantified by its fluorescence at 525 nm, when excited with 488 nm light with the Coulter ELITE ESP flow cytometer. B, a graphical representation of data presented in A. C, Activation of caspase-3 in leinamycin-treated MiaPaCa cells. MiaPaCa cells were incubated with 0, 25, 50, or 100 ng/mL leinamycin for 2 hours, and caspase-3-like activity was measured by the DEVD-AFC-cleavage assay. Data are mean ± SEM of three separate experiments.

