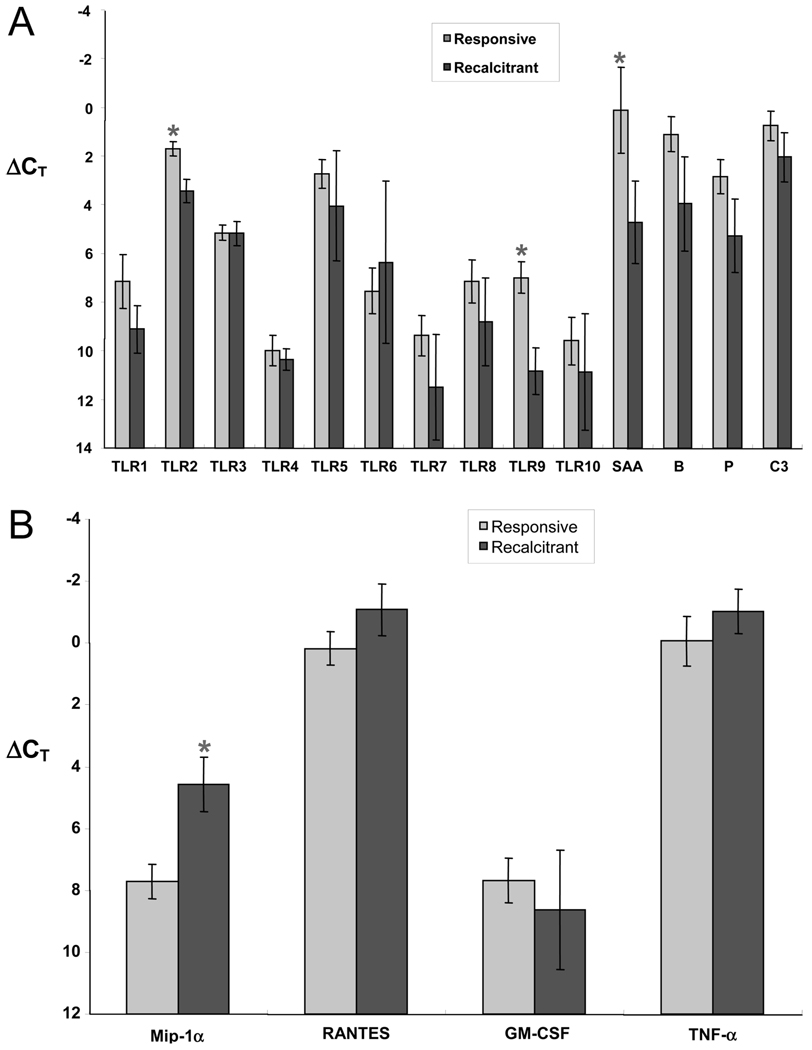
Figure 5.
(A) RT-PCR comparison of the expression of TLR and acute phase protein genes in treatment-responsive (light bars) and recalcitrant CRS (dark bars) samples. Values are ΔCT, normalized to the housekeeping gene GAPDH; a lower ΔCT value corresponds to a higher level of expression. Figure shows decreased expression of TLR2, TLR9, and SAA in sinonasal tissue from CRS patients (*p < 0.05; TLR2, p = 0.003; TLR9, p = 0.002; SAA, p = 0.04). (B) RT-PCR comparison of expression of inflammatory genes in treatment-responsive (light bars) and recalcitrant CRS (dark bars) samples. Values are ΔCT, normalized to the housekeeping gene GAPDH; a lower ΔCT value corresponds to a higher level of expression. Figure shows increased expression of MIP-1α in sinonasal tissue from CRS patients with recalcitrant disease (*p < 0.05, MIP-1α, p < 0.05).

