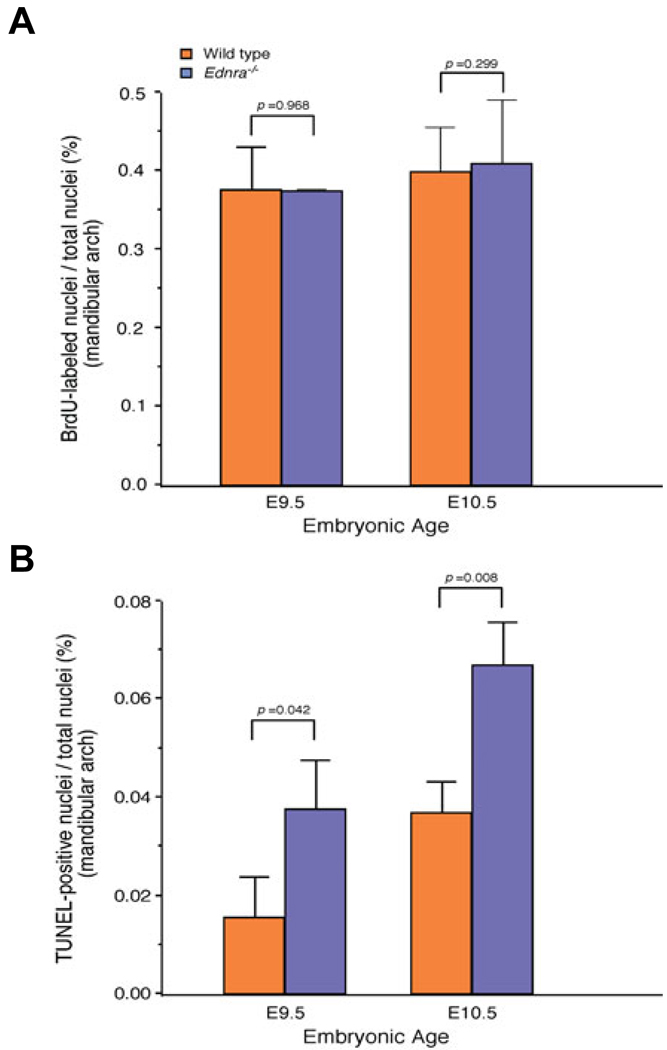
Fig. 7. Quantification of proliferation and cell death in Ednra−/− embryos.
Incidence of proliferating (A) and apoptotic (B) mesenchymal cells in the mandibular arch of wild type (orange) and Ednra−/− (blue) embryos at both E9.5 and E10.5. Values represent the number of labeled nuclei as a percentage of total nuclei. p values comparing both genotypes are listed above each embryonic age.

