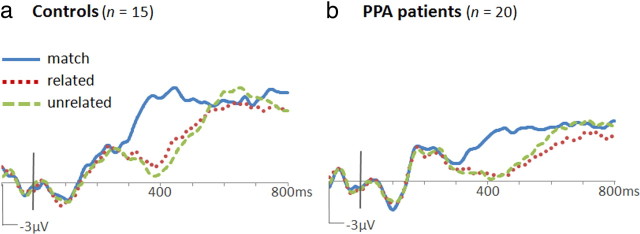
Figure 2.
ERPs to words in the object–word matching task. Waveforms from the Cz location are shown for the control group (a) and the PPA group (b). Positive potentials are plotted up. N400m was evident in both groups as greater negative-going potentials at ∼400 ms after word onset to mismatched words (dotted red and dashed green traces) than to matching words (solid blue trace). N400c was evident in the control group as greater negative-going potentials to unrelated mismatches (dashed green trace) than to related mismatches (dotted red trace).

