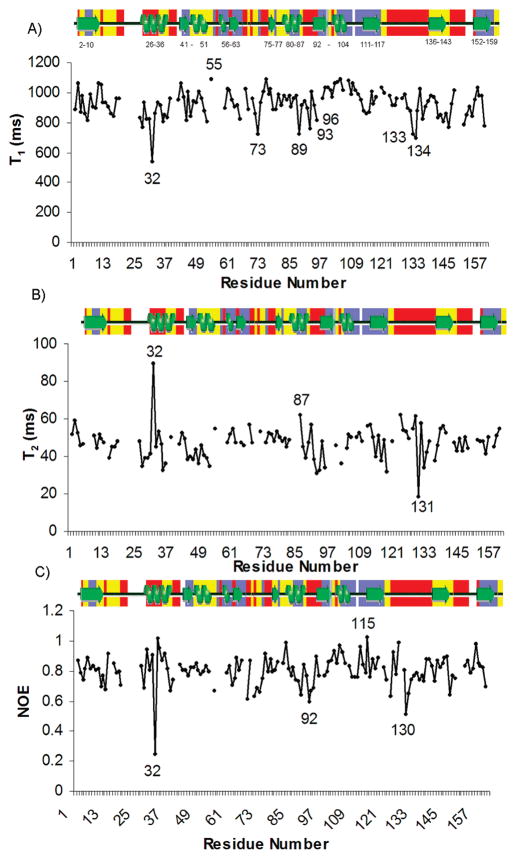
Figure 3.

Relaxation data plotted for the 137 measured amide residues. Labeled secondary structure elements are shown above each plot and colored according to the rate of hydrogen/deuterium exchange (red = fast exchange in 20 min, yellow = intermediate exchange in 1 day, and blue = protected). (A) T1 values, (B) T2 values, and (C) 1H–15N NOE values.
