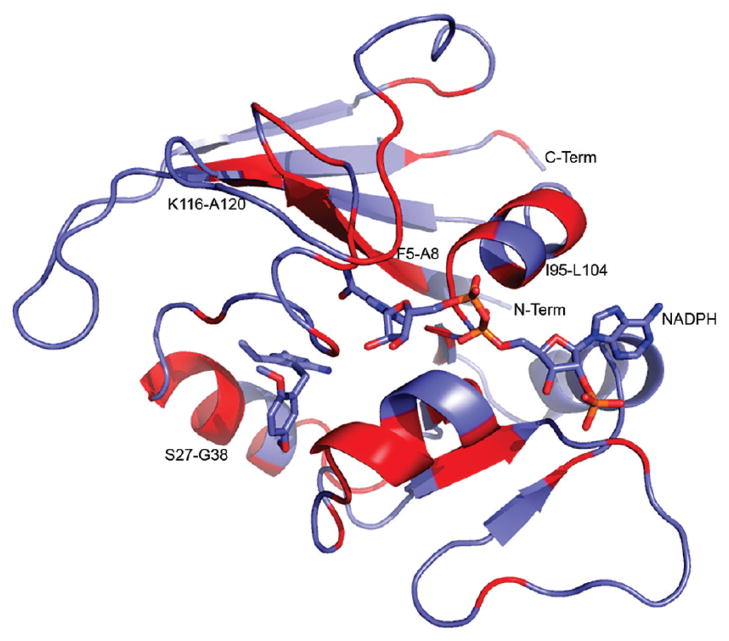
Figure 5.

Cartoon depiction of the solution structure of BaDHFR–NADPH–UCP120B (UCP120B and NADPH are shown in blue sticks). Regions that show significant chemical shift differences between the binary (BaDHFR–NADPH) and ternary (BaDHFR–NADPH–UCP120B) complexes are colored in red. Figure generated in PyMol.
