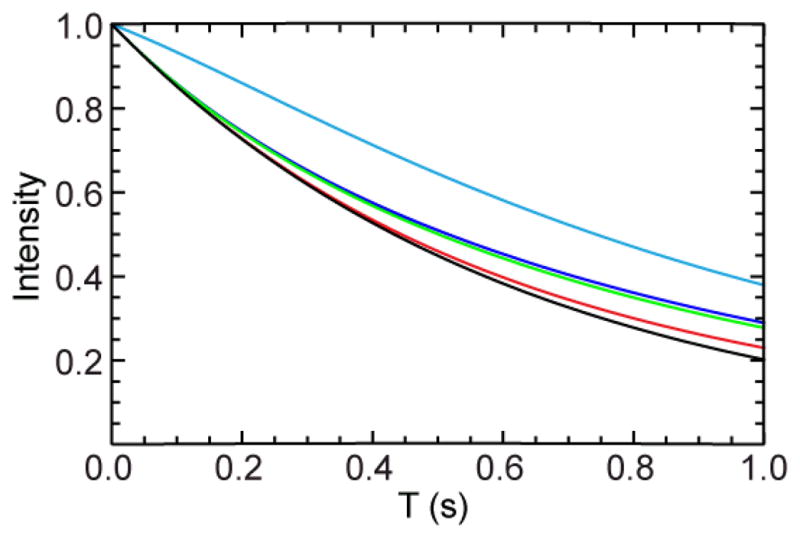
Figure 2.

Simulated trajectories of SzIβ operator during the mixing period when only the S3E element (green), only the S3CT (blue), both S3E and S3CT elements (red), and no S3E or S3CT elements (cyan) are included in the pulse sequence of Figure 1. The black line represents a mono-exponential function with the decay rate equal to R̄1−η z. The relaxation parameters used for the simulations are the following: R1H = 2.5 s−1; R1N = 1.8 s−1; R1HN = 3.8 s−1; ηz = 1.2 s−1; η H = 1.0 s−1; σ = 0.03 s−1. A rotational correlation time of 10 ns was used to estimate the relaxation parameters.
