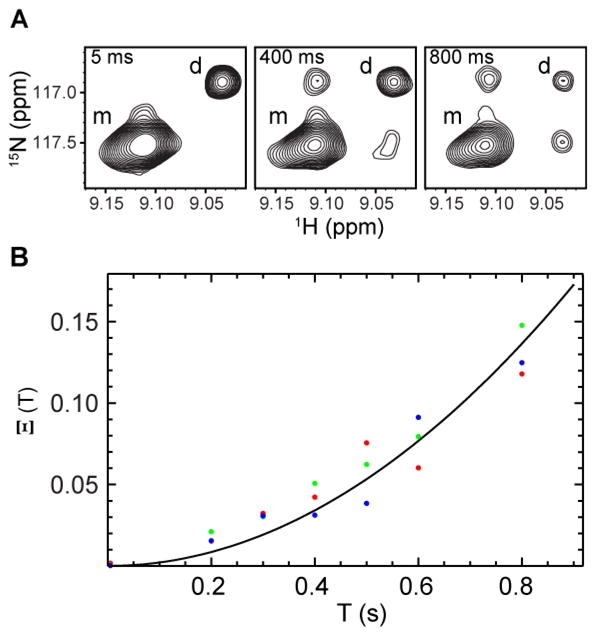
Figure 4.

(A) Typical ZZ-exchange spectra of 15N, 2H-labelled cadherin 8 EC1 domain, showing the buildup of cross-peaks. Monomers and dimers are denoted by m and d, respectively. (B) Buildup curve of the composite ratio of auto- and cross-peak intensities of residues G41 (green), Q49 (red) and A69 (blue). The solid line indicates the fit of the data to eq. 2.
