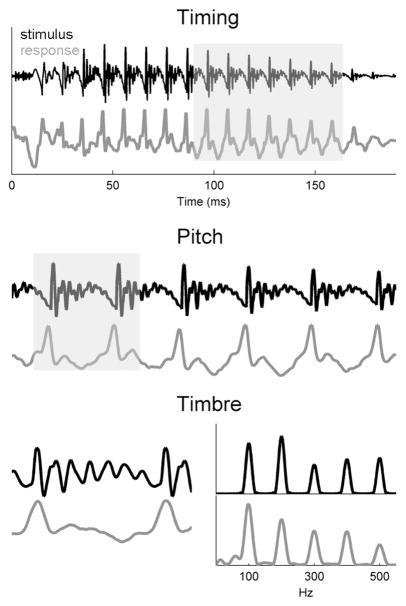
Figure 1.
Schematic representation of timing, pitch, and timbre in the stimulus (black) and brain stem response (gray) waveforms. Top: The full view of the time-domain stimulus waveform “da.” The temporal features of the stimulus, including the sound offset and onset, are preserved in the response. The gray box demarcates six cycles of the fundamental frequency (F0); a blowup of this section is plotted in the middle panel. Middle: Major waveform peaks occur at an interval of 10 ms (i.e., the periodicity of a 100-Hz signal). This stimulus periodicity, which elicits the perception of pitch, is faithfully represented in the response. Bottom: The left panel shows a closeup of an F0 cycle. The harmonics of the stimulus are represented as small-amplitude fluctuations between the major F0 peaks in the stimulus and response. In the right panel, the stimulus and response are plotted in the spectral domain. Frequencies important for the perception of pitch (100 Hz) and timbre (frequencies at multiples of 100 Hz) are maintained in the brain stem response.

