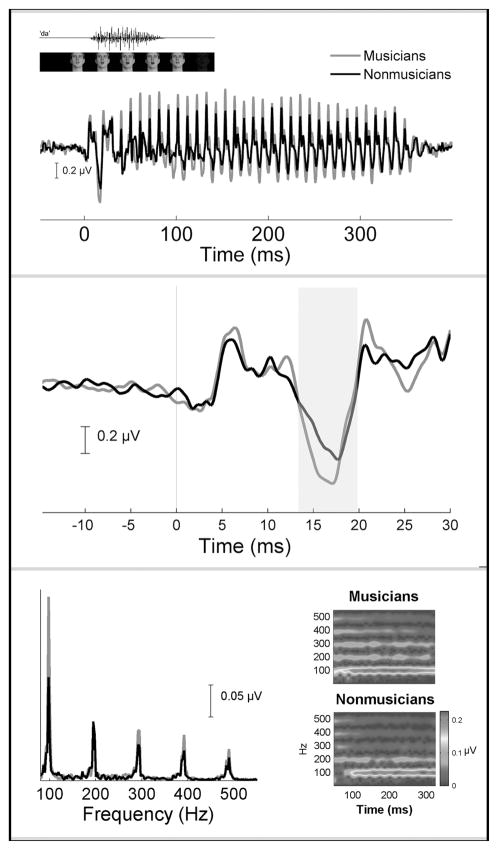
Figure 2.
Grand average brain stem responses to the speech syllable “da” for both musician (red) and non-musician (black) groups in the audiovisual condition. Top: Amplitude differences between the groups are evident over the entire response waveform. These differences translate into enhanced pitch and timbre representation (see bottom panel). Auditory and visual components of the speech stimulus (man saying “da”) are plotted on top. Middle: Musicians exhibit faster (i.e., earlier) onset responses. The grand average brain stem responses in the top panel have been magnified here to highlight the onset response. The large response negativity (shaded region) occurs on average ~0.50 ms earlier for musicians compared to nonmusicians. Bottom. Fourier analysis shows musicians to have more robust amplitudes of the F0 peak (100 Hz) and the peaks corresponding to the harmonics (200, 300, 400, 500 Hz) (left). To illustrate frequency tracking of pitch and harmonics over time, narrow-band spectrograms (right) were calculated to produce time–frequency plots (1-ms resolution) for the musician (right top) and non-musician groups (right bottom). Spectral amplitudes are plotted along a color continuum, with warmer colors corresponding to larger amplitudes and cooler colors representing smaller amplitudes. Musicians have more pronounced harmonic tracking over time. This is reflected in repeating parallel bands of color occurring at 100 Hz intervals. In contrast, the spectrogram for the nonmusician group is more diffuse, and the harmonics appear more faded (i.e., weaker) relative to the musician group. (Adapted from Musacchia et al.9,14) (In color in Annals online.)

