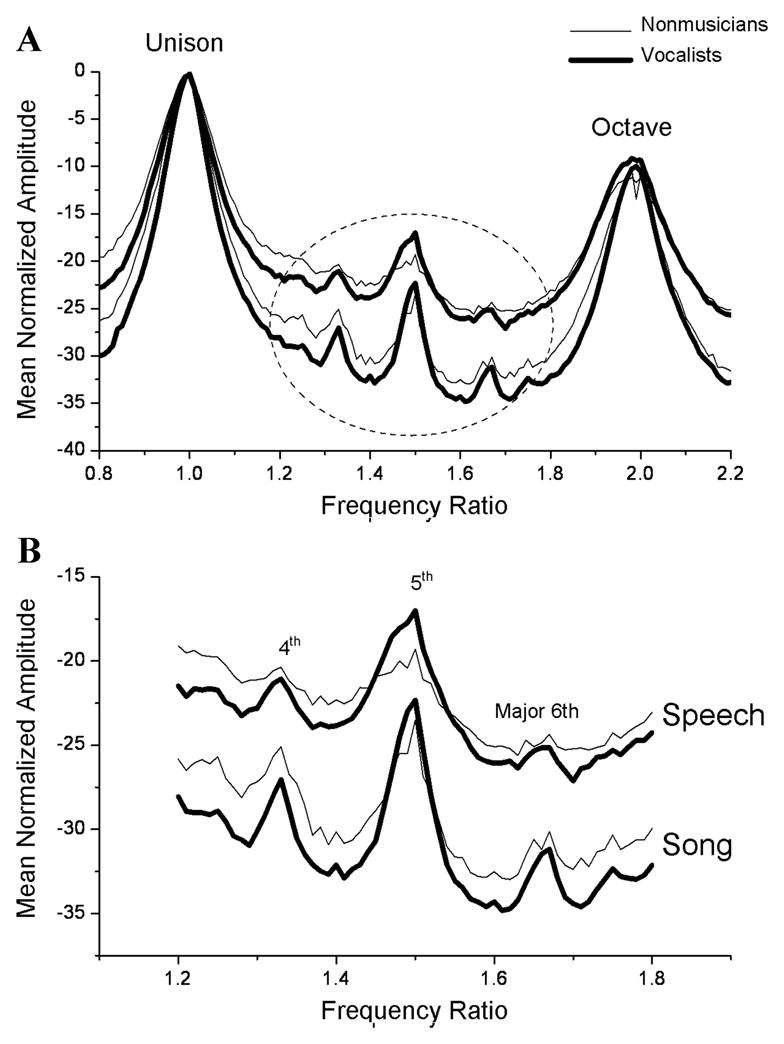
Figure 5.

Normalized spectra of speech (top two traces) and song (bottom two traces) tokens for non-musicians and vocalists. Prominent peaks in the spectra correspond to the intervals of the 12-tone scale. Unison, Perfect 4th, Perfect 5th, Major 6th, and Octave are labeled and represent the most well-defined spectral peaks in the speech and song tokens. Compared to nonmusicians, vocalists and professional musicians (not plotted) have smoother normalized spectra which include fewer unexpected (non–12-tone interval) peaks. The encircled portion of (A) is magnified in (B) to show the decrease in the number of unexpected peaks from speech to song, and from no musical experience to trained vocal experience. (Adapted from Stegemöller et al.31)
