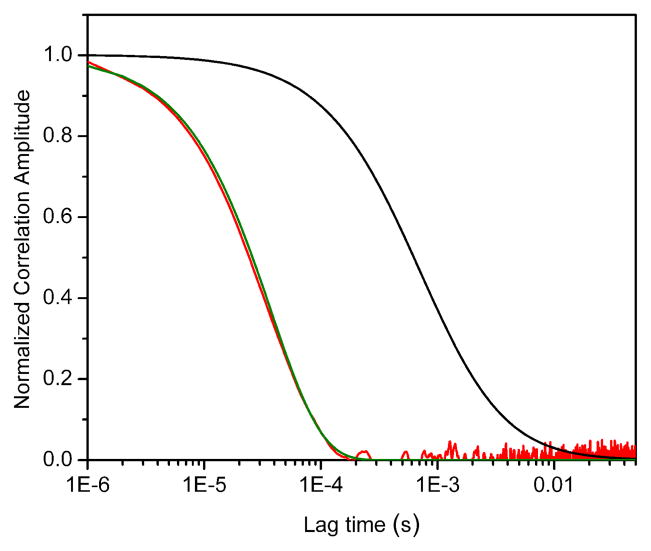
Figure 4.
Results of a computer simulation with parameters τR = 37 μs and τD = 0.94 ms. Red curve: proximity ratio correlation (Gp). Black curve: Diffusion model according to Eq. 9. Green curve: two-state kinetic model (exp[−τ/τR]). All curves have been arbitrarily normalized for clarity.

