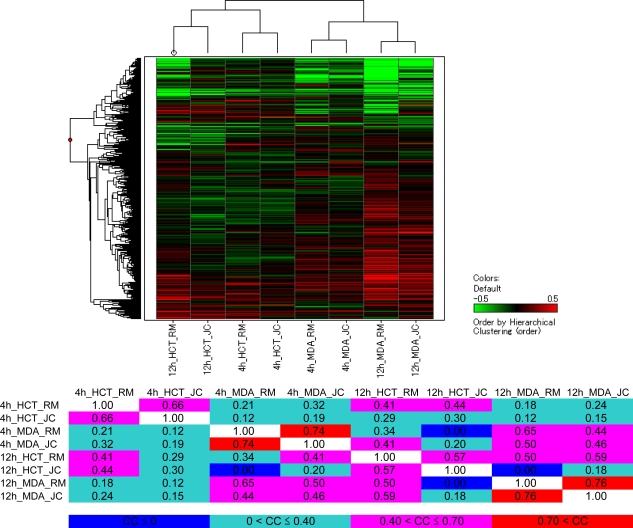
Figure 3.
Correlation between transcriptional signatures of renieramycin M and jorunnamycin C. With respect to two human cancer cell lines (HCT116 and MDA-MB-435) and two time points (4 h and 12 h), hierarchical clustering data on the dendrogram format and cosine coefficient data on the table format are presented. Abbreviations: RM, renieramycin M; JC, jorunnamycin C; HCT, HCT116; MDA, MDA-MB-435; CC, correlation coefficient.

