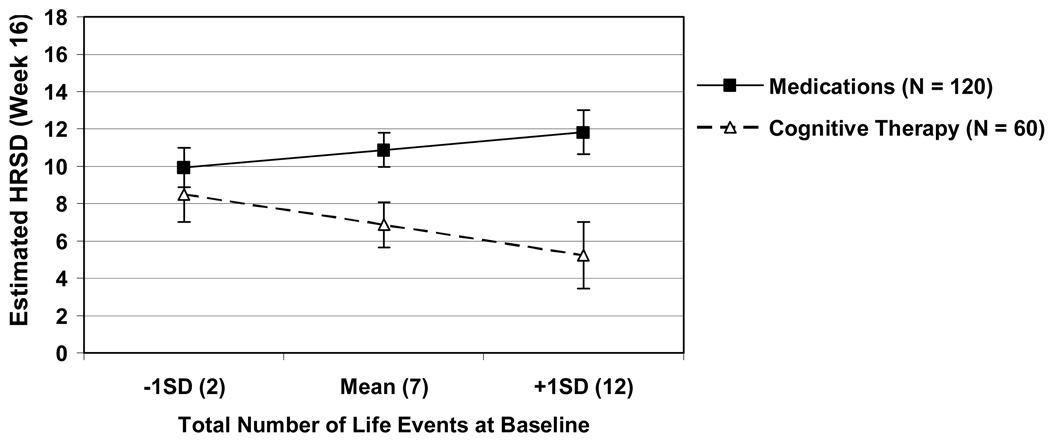
Figure 3.
Estimated Week 16 HRSD (Hamilton Rating Scale for Depression) scores for each treatment at each of three values of the total number of life events reported at baseline: the mean number of life events reported in the sample (M=7, SD=5), one standard deviation below the mean (2), and one standard deviation above the mean (12). Error bars represent +/−1 standard error.

