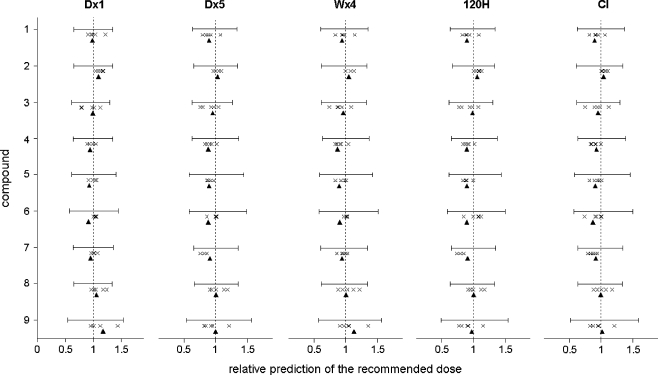
Fig. 8.
Visual representation of the precision of the selection of the recommended dose for the conventional method (ten to 90 percentile range of simulated empirically determined recommended doses, RMSE 30.0%) and for the two-stage model-based design (▴, RMSE 8.3%). The recommended doses that were predicted using data from a single phase I study, are also indicated (✕, RMSE 11.9%)

