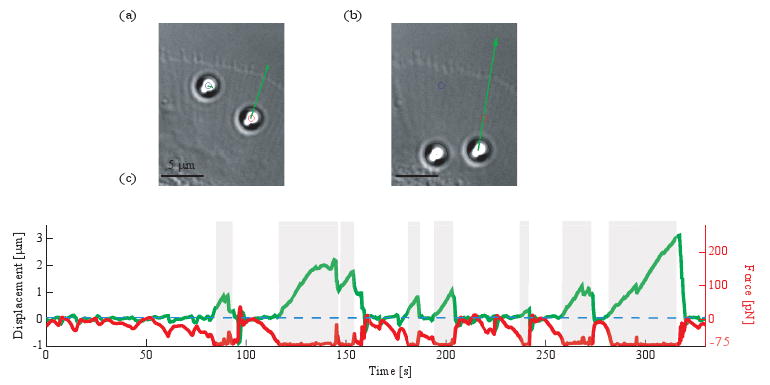
Fig. 4.

Closed-loop force measurement on a live cell (a) (Media 3) Left bead is in a fixed trap (Gp = 0), right bead is in an active trap (Gp = 0.3). Both beads are pulled toward the axon shaft (arrow represents the optical forces). Movie: sped up 30 times, 42 × 54 μm. (b) Force-clamped bead is being displaced toward the axon shaft. (c) Displacement of the bead (green) and optical forces projected along the underlying filopodium (red) over time (shaded regions indicate times when the bead is force-clamped).
