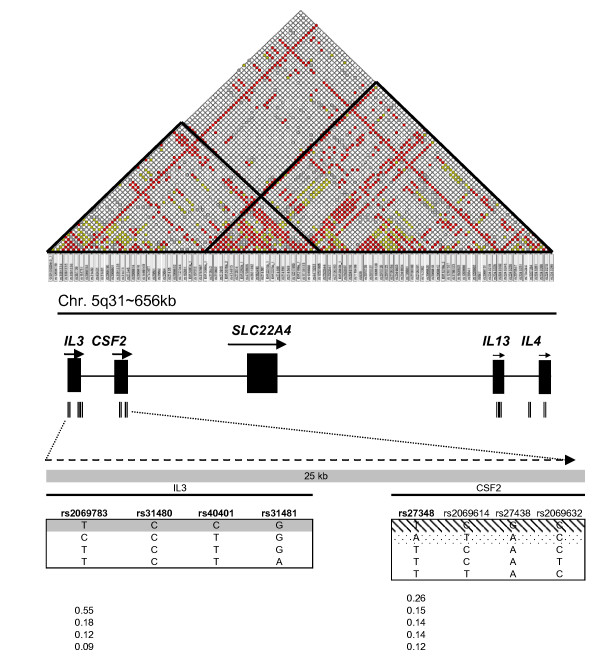
Figure 2.
Top: LD map across a 656 kb segment of the 5q31 region in the Gambian population [22]. Middle: Distribution of the 16 most informative markers (Table 4) that capture the haplotype block structure extending from IL3 to IL4. Bottom; Haplotype structure defined by 8 SNP markers across IL3 and CSF2 illustrating two haplotype blocks and haplotype frequencies within each block beneath. Dots and shading indicate the configuration of the protective and risk haplotypes respectively; the dark shading spanning the IL3 locus shows the haplotype configuration shared by the risk and protective haplotypes.

