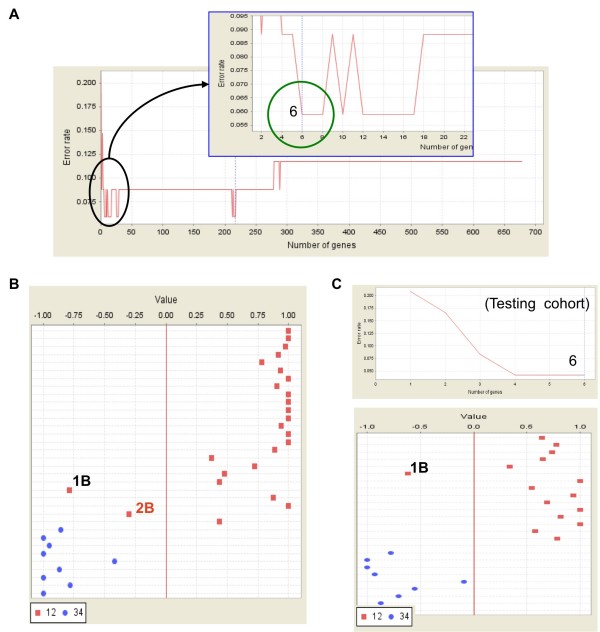
Figure 4.
A six-gene signature dividing early and late EECs. (A) Further narrowing down the existing gene signature to fewer genes. When probe sets were ranked by their signal-to-noise ratios (weights), the top 6 features form the smallest panel which can give the best classification effect. (B) A prediction strength (PS) plot shows the prediction strength of these 6 genes. They give the same classification effect as that of the 217-probeset signature. (C) Signature evaluation by a testing data set. A lowest error rate (upper) and best classification effect (shown by a PS plot; lower panel) was achieved.

