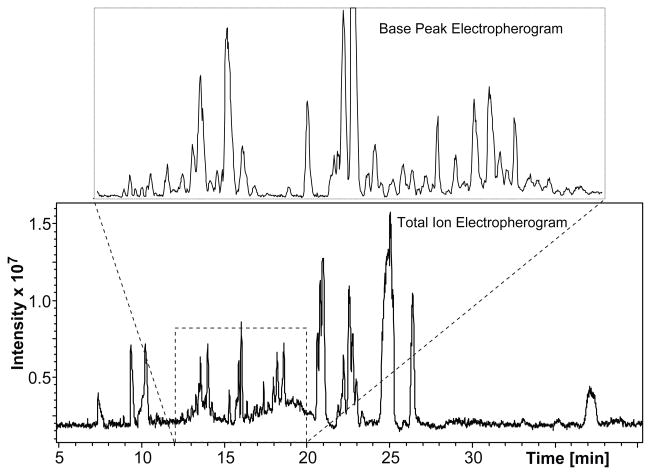
Figure 2.
Metabolomic profiling of a single R2 neuron using CE-ESI-MS. An injection of 0.1% of a single R2 neuron yields a TIE with numerous well-defined peaks. The base peak electropherogram also shows a high-quality separation, with a number of peaks that are either base-line separated or nearly so.

