
Figure 5. Effects of class II HDI on cell cycle and apoptosis in MCF-7 cells.
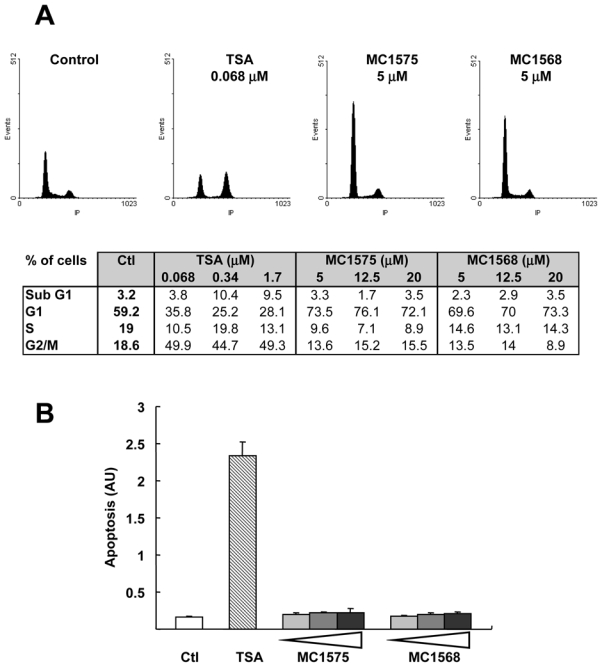
A- MCF-7 cells were treated for 20 h with increasing concentrations of TSA, MC1575, MC1568 or solvent alone (Control). Cell phase distribution was determined by PI staining and FACs analysis. Representative panels obtained for control cells or cells treated with TSA (0.068 μM), MC1575 (5 μM) or MC1568 (5 μM) are shown. In the table are presented the percentages of MCF-7 cells in the various phases of the cell cycle in response to HDI. B- MCF-7 cells were treated for 40 h with TSA (0.068 μM), increasing concentrations of MC1575 and MC1568 (5, 12.5 or 20 μM) or vehicle alone (Ctl) and apoptosis was measured using the Cell Death Detection ELISA kit. Results are expressed as arbitrary units and represent mean and s.d of 4 wells.