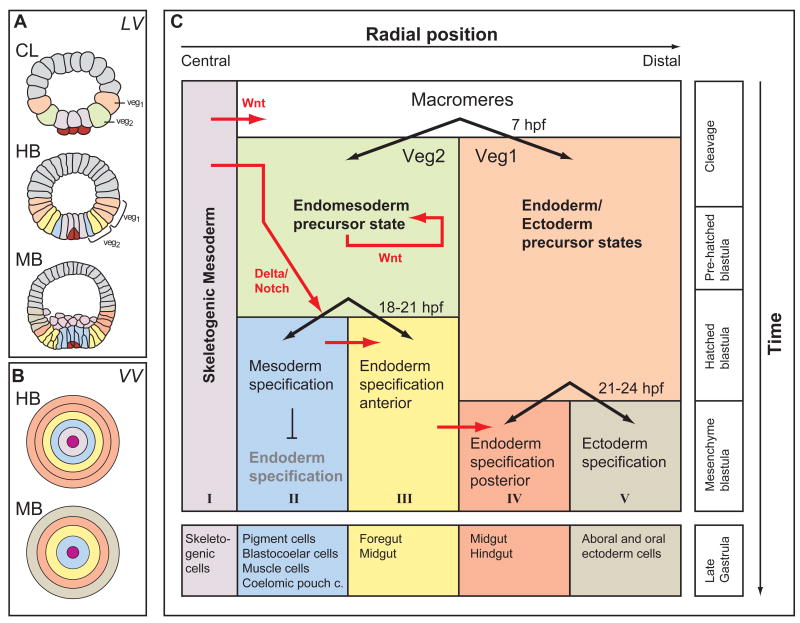
Fig. 1.
Process Diagram indicating regulatory state domains in the sea urchin embryo up to gastrulation. (A) Optical cross sections of embryos at cleavage, 8 h (CL), hatching blastula, 18 h (HB), and mesenchyme blastula, 24 h (MB). Embryos are viewed from the side (lateral view, LV) and color coded to indicate territorial regulatory states. (B) Diagrammatic image of the concentric arrangement of regulatory states viewed from the vegetal pole (vegetal view, VV). (C) Process Diagram: the colored rectangles represent the territories of the endomesoderm. Subdivision of the embryos proceeds in a progressive manner so that just before gastrulation there are five domains indicated at the bottom of the diagram. Modified from Peter and Davidson [12].

