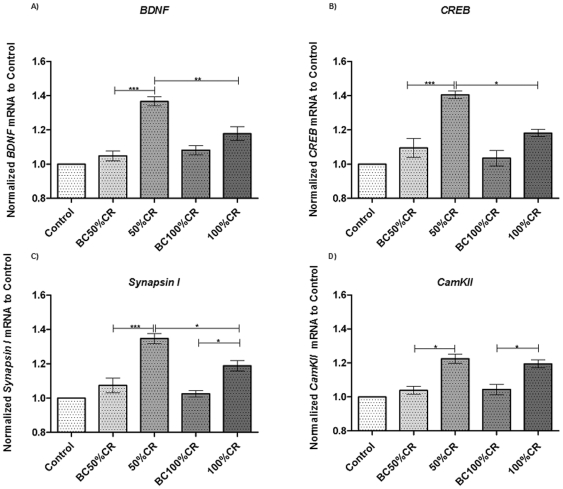
Figure 2. Modification of plasticity related genes levels.
Differential expression of BDNF (panel A), CREB (panel B), Synapsin I (panel C) and CamKII (panel D) in the mPFC due to learning. Values are expressed as a percentage of the cage control value (100%), and represent the mean ± S.E.M. Control group (n = 6); BC50%CR, Box Control 50%CR (n = 6); 50%CR (n = 6); BC100%CR, Box Control 100%CR (n = 6), 100%CR (n = 6). *P<0.05, **P<0.01, ***P<0.001. One way ANOVA followed by Tukey's post hoc test.

