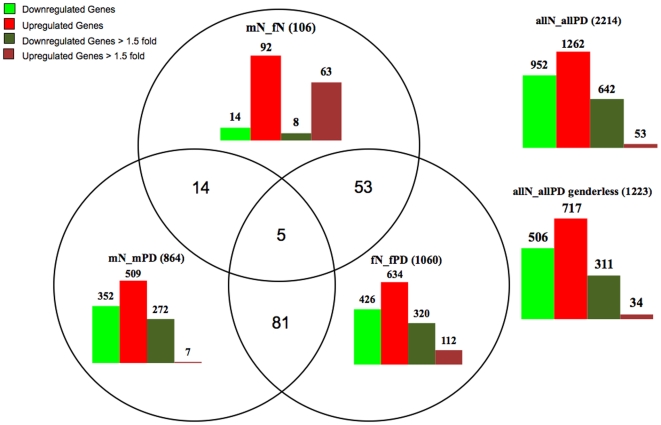
Figure 1. Distribution of gene expression profiles for all groups based on FDR5 p<0.01 analysis.
Genes were computationally analyzed (see Material and Methods for details) and summarized schematically. The groups are as follows: allN_allPD compares all normal versus all PD samples; mN_fN compares control males versus control females; mN_mPD compares control males versus male PD; fN_fPD compares control females versus female PD; the overlapping groups indicate the number of genes that are found in several respective groups. Bars represent numbers of up- or downregulated genes in each group for total genes or after setting the cut-off of differential gene expression at >1.5 fold.

