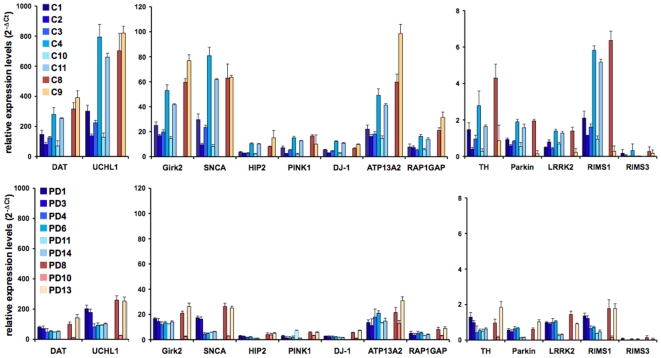
Figure 5. Validation of gene expression by TaqMan® qRT-PCR.
Data were analyzed using the 2−ΔCt method [16] and plotted as relative expression levels of individual genes when normalized to GUSB as internal controls. The bars depict results from six individual male (C1, C2, C3, C4, C10, C11) and two female controls (C8, C9) as well as six male PD (PD1, PD3, PD4, PD6, PD11, PD14) and three female PD samples (PD8, PD10, PD13) (Table S1). Note that samples C3, C10, C11, PD3, PD4, and PD11 were taken from [12]. Genes were clustered according to high (DAT, UCHL1), medium (Girk2, SNCA, HIP2, DJ-1, ATP13A2, RAP1GA1), and low (TH, Parkin, PINK1, LRRK2, RIMS1 and 3) expressing genes.

