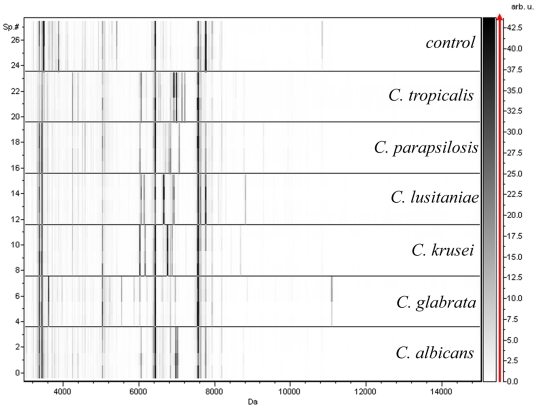
Figure 1. Alterations in the mass spectra (virtual gel) of blood cultures injected with different yeast strains.
The x-axis represents Da value, For each strain 4 spectra (numbered on the left Y-axis) from two biological replicates deposited twice on the spectrometer plate are presented. A grey colour scale for peak intensity with arbitrary units is provided on the right y-axis. Each spectrum was automatically collected in the positive ion mode as an average of 700 laser shots. Mass range 3,000–20,000 Da was selected with a signal/noise ratio >3 (S/N) and resolution better than 600 (Flexcontrol software 2.4; Bruker-Daltonics). The control sample was from a yeast-free blood culture.

