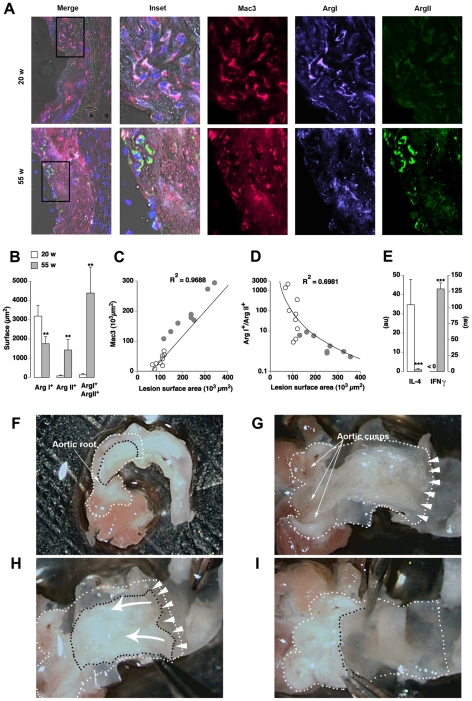
Figure 3. Macrophages of early atherosclerotic lesions in ApoE KO mice express Arg I while Arg II predominates in late stages.
A: Immunofluorescence of atherosclerotic lesions from 20 and 55 week-old ApoE KO mice. MØ were identified as Mac3+ (red) cells. Co-expression of Mac3 and Arg I (violet) and/or Arg II (green) were identified by image overlay. Merge: overlay of bright field, DAPI, Mac3, Arg I and Arg II stainings. Inset: magnification of the zone delimited in the “Merge” frame. B: Arg I, Arg II and Arg I+ Arg II+ double positive surface areas within 3 random fields/plaque of 20 (white) and 55 (grey) week-old mice. C, D: Regression analysis between the surface area of plaques (X-axis) and total MØ area (Mac3, C) or the Arg I+/Arg II+ ratio (D). R2: regression correlation coefficient. E: Expression of IL-4 and IFNγ transcripts on microdissected atherosclerotic lesions from 20 and 55 week-old ApoE KO mice determined by real time PCR and normalized by HPRT (au: arbitrary unit). **; ***: p<0.001; p<0.0001 vs 20 w. F–I: Microdissection of aortic atherosclerotic lesions. Lesions can be detected (delimited by black dashes) through the vascular wall in the dissected aortic root (white dashes). The vascular wall was opened longitudinally to expose the luminal side of the vessel (G). The aortic cusps are readily identified. Arrow heads indicate the plane of fracture at the lesion/media interface, which allows the separation of the lesion from the media. The arrows in H indicate the movement performed with tweezers to detach the lesion. Appearance of the vessel after the dissection of the lesion is shown in I.

