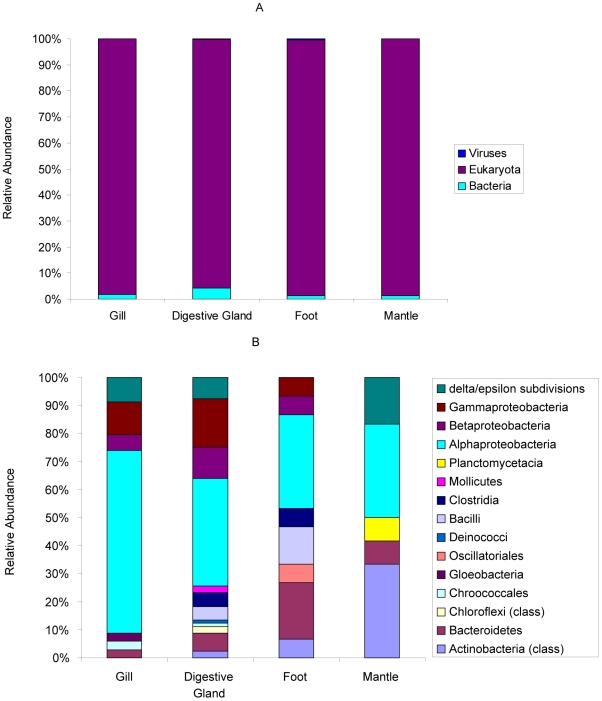
Figure 7. Taxonomic classification of reads in each tissue.
Domain-level (A) and bacterial class-level (B) taxonomic distribution of reads for each tissue of M. galloprovincialis. Taxonomy annotation is derived from the taxonomy of protein homologue from BLAST alignment with an e-value cut-off of 1×10⁻¹⁰ and a minimum alignment of 50 bp.

